
- Case study
- Enterprise Solutions & Advisory
Delivering Measurable Improvements in Trading and Risk Reporting
Six reporting initiatives transformed fragmented data and static reports into interactive, reliable, and scalable analytics, improving access to critical position, P&L, risk, and market information.
- ETRM/CTRM Solutions
5key outcomes
delivered
The challenge
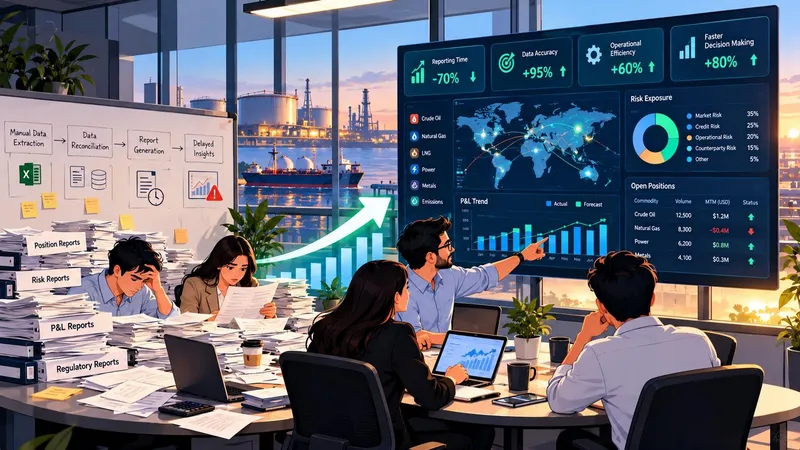
Trading and risk teams needed faster access to information, stronger historical visibility, and more consistent reporting across business functions.
Large spreadsheets, manual analysis, and disconnected reporting systems limited productivity and made it difficult to identify market trends, anomalies, and performance changes.
Our approach
We introduced interactive dashboards, historical analytics, specialized reporting views, and modernized enterprise reports to create a more accessible and dependable reporting environment.
- Enabled access to more than five years of market data
- Modernized over 30 production report pages
- Created dedicated Front Office and Middle Office views
- Delivered consistent reporting across integrated platforms
- Introduced drill-through analytics and advanced visualizations
These improvements were implemented while maintaining business continuity and minimizing disruption to existing operations.
The results
The transformed reporting environment gave users direct access to relevant position, P&L, market, and risk information. Interactive dashboards reduced navigation effort and replaced time-consuming manual analysis.
Multi-year historical data improved trend identification, while scatter plots, candlestick charts, and drill-through analytics made market movements and anomalies easier to recognize.
Enterprise reports were modernized without interrupting production operations, improving reporting accuracy, consistency, usability, and scalability.
- 5+ Yearshistorical market data for trend and performance analysis
- 30+ Pagesproduction report pages enhanced and modernized
- 2 Viewsdedicated to Front Office and Middle Office teams
- 100%consistent reporting across integrated platforms
Business impact
-
Faster Information Discovery
Direct navigation helps users find relevant position, P&L, and risk information with less manual effort.
-
Enhanced Reporting Experience
Interactive dashboards replace static spreadsheets, improving usability and reducing repetitive analysis.
-
Greater Historical Visibility
More than five years of data supports faster trend analysis and stronger performance comparisons.
-
Deeper Market Insights
Advanced visualizations and drill-through analytics make trends, anomalies, and market movements easier to identify.
-
Modern Enterprise Reporting
More than 30 production report pages were enhanced while maintaining data consistency and business continuity.
Want a result like this?
Tell us where you are today. We'll show you what we'd do first.